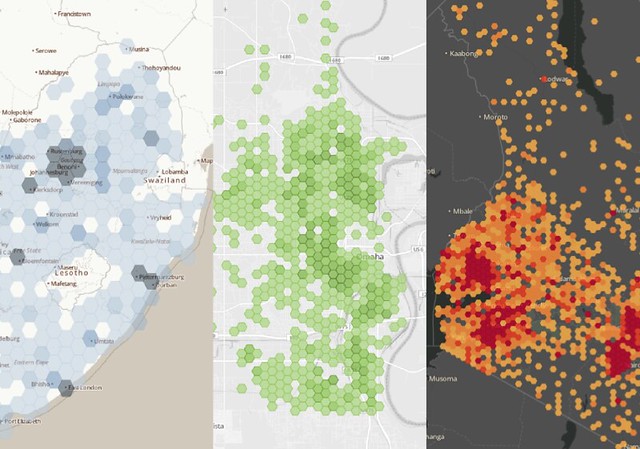
Binning: An Alternative to Point Maps | Mapbox
▻https://www.mapbox.com/blog/binning-alternative-point-maps
Binning is a great alternative technique for visualizing density when working with large data sets.
Binning: An Alternative to Point Maps | Mapbox
▻https://www.mapbox.com/blog/binning-alternative-point-maps
Binning is a great alternative technique for visualizing density when working with large data sets.

plein d’exemples en #d3.js : hexagones, triangles, carrés…
▻http://blockbuilder.org/search#text=bin

Tiens, ça me fait penser que je n’ai pas vu de code postal (#geohash, #openlocationcode, #what3words) basé sur une grille hexagonale. Ça n’apporterait sûrement rien de plus que les grilles rectangulaires, mais ça serait joli :)
Triangles
▻http://blockbuilder.org/armollica/dcfa9c27db140183bd87f3fc90efaf10

Cartogramme :
▻http://blockbuilder.org/shimizu/661f5e59ec3e848ad764

Hexagones, avec diamètre variable :
▻http://blockbuilder.org/mbostock/4330486

Hémicycle :

@fil oui, c’est aussi possible avec #turf.js :)
▻http://jsfiddle.net/nathansnider/ts4oyyn0
▻https://paulcrickard.wordpress.com/2015/02/18/density-map-with-turf-js
Je postais le lien original ici car j’en avais assez de le trimballer dans les onglets de mon nav depuis des mois :p
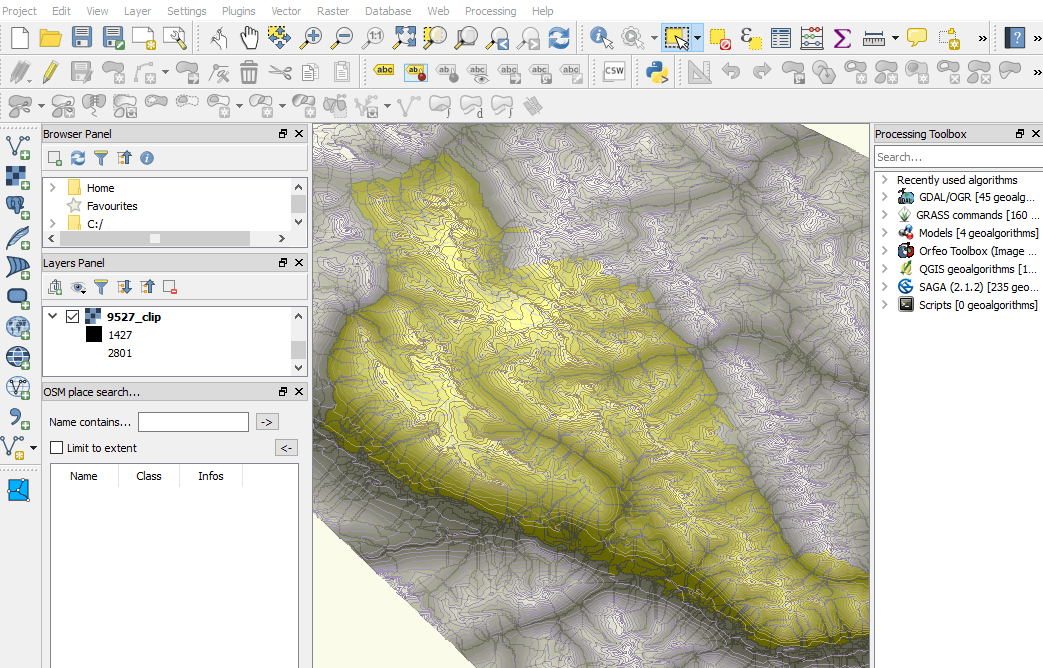
How to create mountain ranges in #qgis?- Digital Geography
▻http://www.digital-geography.com/create-mountain-ranges-qgis
Last time we had the task to create mountain ranges polygons for the whole world. I prepared a small tutorial referred to that.


À la rencontre des #géographes libres – Framablog
▻http://framablog.org/2016/05/05/a-la-rencontre-des-geographes-libres
Quand on parle de #logiciel #libre personnellement je pense immédiatement à des questions de justice sociale et justice spatiale (ben oui :-p). La #cartographie est initialement un #outil mobilisé pour la conquête. Qu’on pense au militaire ou au navigateur, leurs objectifs étaient de prendre possession de l’#espace. Quand j’ai commencé à travailler avec des outils géomatiques, le libre existait bien sûr, mais il n’avait pas le droit de cité dans ma formation. Et je me suis retrouvé en stage dans une structure qui n’avait pas les moyens de se doter de logiciels « métier ».
Le logiciel libre a été un moyen de s’émanciper de cette contrainte et de permettre à la structure en question de pouvoir continuer à utiliser mon travail. Aujourd’hui les choses ont beaucoup changé, en grande partie grâce à #Qgis qui a complètement redistribué les cartes (haha). De plus en plus de formations proposent des cours sur Qgis en plus des outils plus « traditionnels », et le dynamisme de la communauté des utilisateurs et des développeurs y est pour beaucoup !
Le web n’est pas à la traîne, openLayer est une librairie JavaScript incontournable, postgreSQL et PostGIS pour le stockage en base de données se sont largement imposés, etc . Donc pour moi les logiciels libres de l’OSGeo répondent bien aux questions de justice sociale en permettant à tous d’avoir accès à des logiciels et des algorithmes de qualité, ce qui nous conduit à la justice spatiale… il n’y a plus de contraintes à ce que la terre soit cartographiée par les gens qui la vivent !
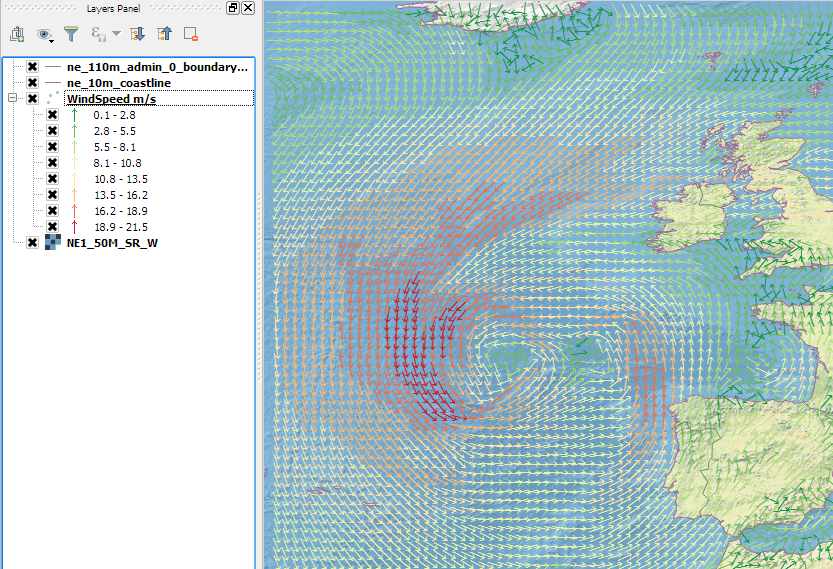
From Cloud to GIS : Getting Weather Data.
In this post we are going to look at how to get weather forecast data and display it as a layer in a desktop geographical information system (GIS).
▻http://www.digital-geography.com/cloud-gis-getting-weather-data
Découverte de ce #plugin pour #qgis dans les commentaires de l’article :
▻http://www.lutraconsulting.co.uk/products/crayfish
The Crayfish plugin aspires to be a time explorer for structured and unstructured mesh and vector datasets within QGIS. With Crayfish, users can load time varying mesh into QGIS. It currently supports several meteorology, hydrology and oceanography file formats.
ps : j’avais oublié le lien vers le premier article :p
Currently, Crayfish supports a number of file formats: NetCDF, GRIB, XMDF, Selafin files, SMS DAT and SWW. Examples of the software packages are: TUFLOW, AnuGA, BASEMENT, Flood Modeller 2D, HECRAS 2D, TELEMAC and Hydro_AS 2D.
Crayfish also allows user to view NetCDF and GRIB files directly in QGIS. In the example below, global temprature dataset (GRIB fromat) can be seen in QGIS.
#qgis – Récupérer des palettes de couleurs depuis ColourLovers.com – GIS-Blog.fr
▻http://www.gis-blog.fr/2016/03/23/qgis-recuperer-des-palettes-de-couleurs-depuis-colourlovers-com
Voici un nouveau script qui permet de récupérer une palette de couleur à partir du site ColourLovers.com
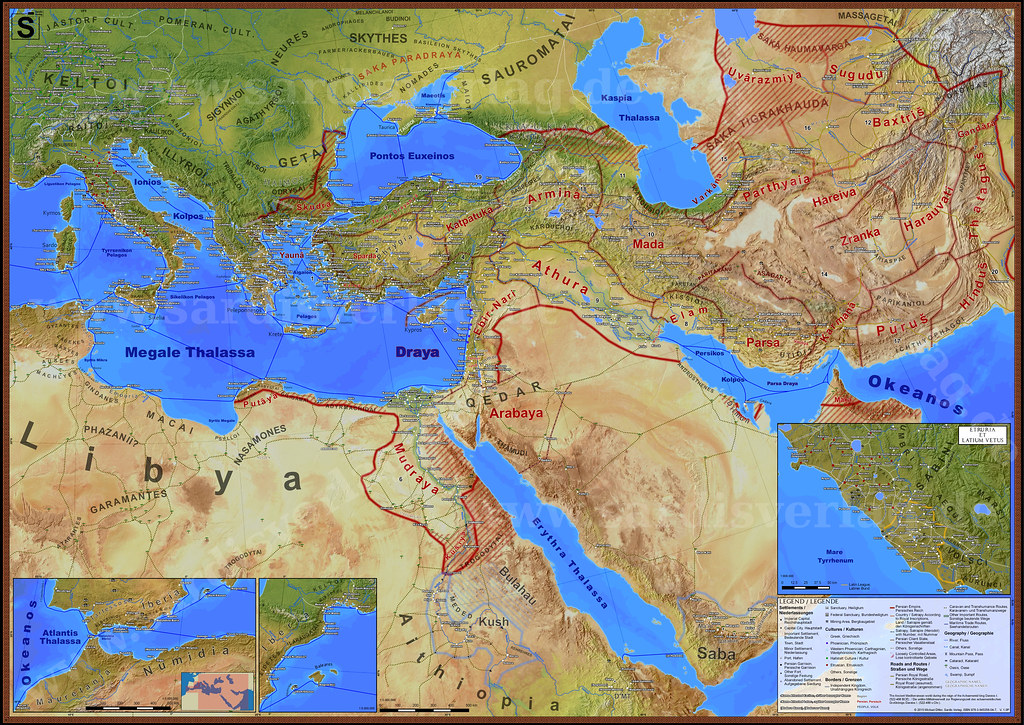
#map
Quelques cartes produites avec #QGIS, repérées dans le groupe dédié


From Paper Maps to the Web: A DIY Digital Maps Primer by Mauricio Giraldo Arteaga | The New York Public Library
▻http://www.nypl.org/blog/2015/01/05/web-maps-primer
▻http://mapwarper.net
Map Warper is a web tool that lets you upload your scanned maps and provides a simple interface for you to geo-reference them (or “rectify” in geo parlance).
Sympa mapwarper, de mon côté je le fais avec #qgis cf : ►http://seenthis.net/messages/191906
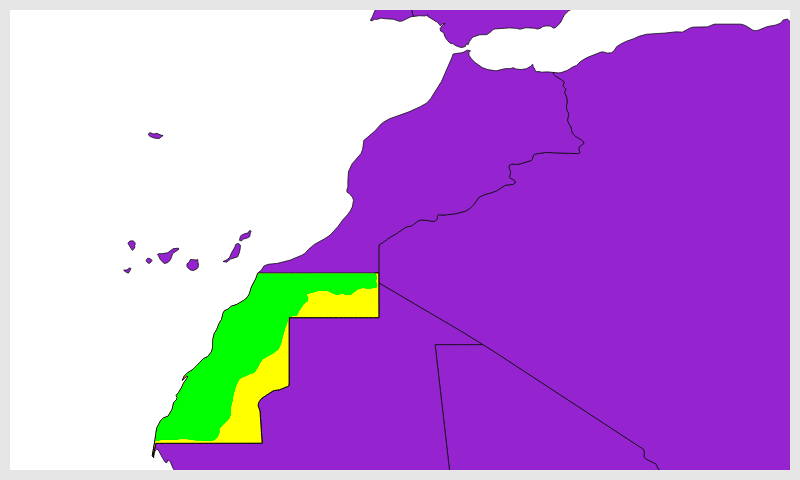
Moving Borders with QGIS | Aten Design Group
▻http://atendesigngroup.com/blog/moving-borders-qgis
the Sahrawi Arab Democratic Republic (SADR) which is currently recognized by 84 UN member states claims approximately the southern half of this area.

Natural Earth Vector draws boundaries of sovereign states according to defacto status. We show who actually controls the situation on the ground. For instance, we show China and Taiwan as two separate states. But we show Palestine as part of Israel. Please feel free to mashup our countries and disputed areas themes to match your particular political outlook.
▻http://www.naturalearthdata.com/downloads/10m-cultural-vectors/10m-admin-0-details
▻http://www.naturalearthdata.com/forums/topic/disputed-territories-type-field
bon alors, j’ai suivi le tuto, mais malheureusement ça ne marche qu’à moitié : j’ai bien la « frontière » entre MAR et SAH, mais la topologie de la frontière entre SAH et MRT n’est pas bonne…en fait je suis pas certain que ce soit le bon outil
à suivre
PS : ça y est j’ai fini par trouver une procédure adéquate.
Natural Earth et la frontière Maroc-Algérie c’est aussi un peu approximatif … ci-dessous la différence entre les versions 110m et 50m du fichier admin_0_countries :
AutoTrace #plugin for #qgis - Lutra Consulting
▻http://www.lutraconsulting.co.uk/products/autotrace
AutoTrace is a plugin for QGIS that allows users to digitise new features based on vertices from existing features. It essentially allows you to trace existing features.
▻https://www.youtube.com/watch?v=JOUpLuFbd7I
via ▻http://www.digital-geography.com/how-a-qgis-plugin-saved-my-day-autotrace
#map
Data & GIS tips: Corine Disco Cover
▻http://datagistips.blogspot.fr/2015/12/corine-disco-cover.html
This post is about the making of an experimental video that dives into the land cover of Paris & its surroundings with a hint of RGB magic. You’ll see the purpose of gridding, how to cross a vector and a raster layer in #R. Finally we’ll cover one of the latest functionnality of 2.12 : data-defined layer combinations in atlases. ▻https://vimeo.com/148335254

Using OpenStreetMap Data with Open-Source GIS | Markieta | Cartographic Perspectives
▻http://cartoperspectives.org/index.php/journal/article/view/cp71-markieta/138
INTRODUCTION
For many, free and open-source data and software represents accessibility to otherwise inaccessible geospatial workflows in terms of cost and availability. Commercial data used in geographic information systems (GIS) is available through a relatively small number of merchants or vendors, which produce highly accurate, precise, and detailed information. This is produced, however, at a cost that many small and large businesses, private consultants, and startups cannot afford. Open-source data, such as the volunteer geographic information on OpenStreetMap (OSM), represents a community effort to build one of the best web maps, and subsequently the best GIS database, available for free to the public. OpenStreetMap is a web-based map to which any registered user can submit data. These updates, over time, populate the now extensive web map that is the OpenStreetMap. At the same time, the data that lives on the OpenStreetMap can be downloaded and used inside of a GIS for geospatial analysis, cartographic rendering, and other geo-related tasks.
There are various workflows for extracting and consuming the data that is made available by the OpenStreetMap project. One of these methods is outlined in this tutorial. This tutorial will take Mac OSX users through a typical setup of a local PostgreSQL database, downloading and parsing raw OpenStreetMap data, and querying the database to extract data for use in QGIS, an open-source GIS package. Upon completing this tutorial, users will have hit the ground running, with the ability to run spatial queries—such as locating all the coffee shops within 500 metres of a subway station—or building cartographically pleasing reference map books with data that is of interest to the map reader.
THIS TUTORIAL WILL COVER THE FOLLOWING:
Access and browse an OSM data repositories
Download a subset (often called an “extract”) of the planet.osm data package
Install PostgreSQL (object-relational database system)
Install PostGIS for use with PostgreSQL (spatial database extension for PostgreSQL)
Install and utilize osm2pgsql (converts OSM data for use in the PostgreSQL database)
Install QGIS and its dependencies (GIS package)
Query and add data in QGIS from PostGIS/PostgreSQL
La version 2.12 de #QGIS nom de code Lyon est dispo, sacré changelog :
▻http://changelog.qgis.org/qgis/version/2.12.0
 http://changelog.qgis.org/media/images/entries/215ead2dd5e43e394d47169a7fd82aa5cc08b6b6.png
  http://changelog.qgis.org/media/images/entries/30f2ab32f4ae0d135a26b6a6ddb6705f0f6dd74a.png
 #map
fraxen/tectonicplates · GitHub
▻https://github.com/fraxen/tectonicplates
World tectonic plates and boundaries : this is a conversion of the dataset originally published in the paper An updated digital model of plate boundaries by Peter Bird (Geochemistry Geophysics Geosystems, 4(3), 1027, doi:10.1029/2001GC000252, 2003).The dataset presents tectonic plates and their boundaries, and in addition orogens and information about the boundaries.
Flux #wms et WFS pour #qgis | GIS-Blog.fr
▻http://www.gis-blog.fr/2015/08/19/flux-wms-et-wfs-pour-qgis
Étant régulièrement en train de courir après des flux WMS ou WFS, j’ai décidé de créer deux listes (non exhaustives) de flux WMS et WFS. N’hésitez pas à amender ces listings ou à me faire part de manques. ▻https://github.com/igeofr/qgis2/tree/master/flux
#map
QField | #android · GIS · WEB
▻http://www.opengis.ch/android-gis/qfield
QField allows you to take your #qgis projects out of the office for effective field work. By maintaining QGIS’ styling and edit widgets QField greatly reduces preparation time. QField is built from ground up to be touch oriented and easy to use outside. and follows the following paradigm: GPS centric, QGIS desktop compatible, Fully working when offline, Synchronization capabilities, Project preparation on desktop, Few and large buttons, Switchable use paradigm (Display, Digitizing, Measuring, Inspection,…) Available features: navigation (pan, zoom), feature identification, attribute editing
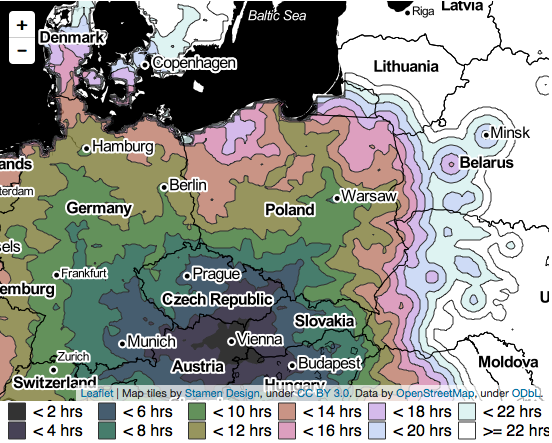
How far can you travel? Answers in #qgis with OSM route. - Digital Geography
▻http://www.digital-geography.com/how-far-can-you-travel-answers-in-qgis-with-osm-route
OSM route is more or less a possibility to interact with the service behind the domain openrouteservice.org. It lets you use addresses as input for your start- and end-point as well as an address to be on the way.But that’s not all! Additionally to routing you can use the plugin to calculate the reachability of places in a given time period. So called isochrones.
▻https://github.com/Geolicious/OSMroute How to create illuminated contours, Tanaka-style | Free and Open Source GIS Ramblings
▻http://anitagraser.com/2015/05/24/how-to-create-illuminated-contours-tanaka-style
ah super justement je suis à la recherche d’une méthode pour ça (sous D3.js de préférence, mais au pire je ferai avec QGIS puis export en geojson)
quelques sources d’inspiration :
en fait là il s’agit d’utiliser joliment des contours provenant de données DEM (altitudes…) ; ce que je cherchais est un truc connexe : un script de calculs de contours
J’ai trouvé ça :
▻http://bl.ocks.org/mbostock/4241134

conrec.js
La suite : A Processing model for Tanaka contours
If you follow my blog, you’ve most certainly seen the post How to create illuminated contours, Tanaka-style from earlier this year. As Victor Olaya noted correctly in the comments, the workflow to create this effect lends itself perfectly to being automated with a Processing model.
The model needs only two inputs: the digital elevation model raster and the interval at which we want the contours to be created.
▻http://anitagraser.com/2015/07/12/a-processing-model-for-tanaka-contours
▻https://github.com/anitagraser/QGIS-Processing-tools/blob/master/2.9/tanaka_contours.model
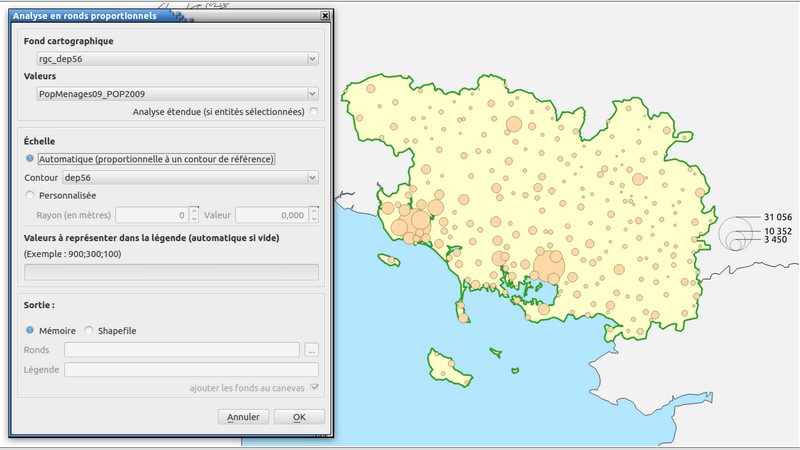
LCacheux68224/ProportionalCircles · GitHub
▻https://github.com/LCacheux68224/ProportionalCircles
Analyse en ronds proportionnels avec échelle et légende automatique

Pour monter un petit serveur carto à la maison ! #WMS et #WFS
Running QGIS Server from a Raspberry Pi | PopGeo
▻http://www.popgeo.net/?p=69
How to : watercolor pastel style in #qgis | Free and Open Source GIS Ramblings
▻http://anitagraser.com/2015/01/04/how-to-watercolor-pastel-style-in-qgis
#map